
 |
Welcome to Gamutvision |  |
GamutvisionTM is a color gamut viewer and much more. It is a powerful tool for learning color management, exploring its functions, and proofing color workflows. With Gamutvision you can
| – | View gamuts of color spaces, displays, and printers. |
|
||||||||||||
| – | Visualize gamut mappings and rendering intents. | |||||||||||||
| – | View color response for ANY saturation and lightness level, not just the gamut surface. | |||||||||||||
| – | Evaluate ICC profile quality. | |||||||||||||
| – | Preview printer, paper, and photo lab performance using downloaded profiles. | |||||||||||||
| – | Analyze the performance of your printer using scanned test prints. | |||||||||||||
| – | See precisely how image colors will change when printed. | |||||||||||||
| Gamutvision was developed by Imatest LLC in early 2006. In mid-2016 it was released as a free program with no purchase or registration required. The reasons: The 11-year old ICCTrans routine is not supported and only works with 32-bit Matlab (though its source code is available on Github). Current Matlab versions are 64-bit-only. Registration did not work with Windows 10 and worked poorly with offline computers. We are focusing our resources on the enhancement of the Imatest image quality analysis program. |

|
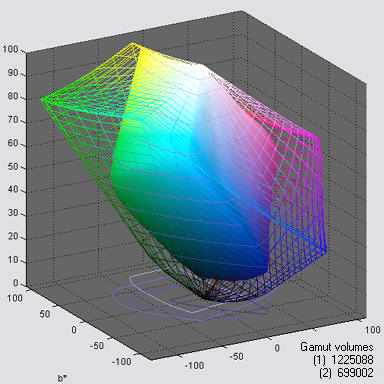
Gamutvision illustration A 3D L*a*b* Gamutvision display showing the color gamuts of
This is one of several Gamutvision displays. It can be zoomed and rotated (manually or automatically), and Saturation S can be reduced to display the gamut interior. The L*a*b* gamut volume is optionally displayed on the lower-right. To learn more about Gamutvision, take the tour. |
You can download an evaluation version that allows up to 20 ICC profiles to be analyzed. Online purchase and registration is available. The purchase price includes one year of upgrades.
Gamutvision operates under Windows* 2000, 2003, XP, Vista or Windows 7 and on Macintosh systems with Virtual PC 6 or 7. Minimum RAM is 256 MB; minimum screen size is 1024x768. (*Not supported on Windows 98SE and ME, but may work on some installations.)
News highlights Full descriptions of updates can be found in the Change Log. Latest version: Oct. 15, 2016. Gamutvision 1.4, Identical to 1.3.7, but does not require purchase or registration. Feb. 15, 2008. Gamutvision 1.3.7. CIEDE2000 color difference metrics (ΔE00, etc.) have been added. May 14, 2007. Gamutvision 1.3.5. 3D displays can rotated automatically by pressing the button. Jan. 2, 2007. Gamutvision 1.3.1 displays the 3D L*a*b* gamut volume. 1.3 (Jan. 1) displays 3D L*a*b* vector plots illustrating how image colors change with gamut mapping or printing. It also analyzes a simulated GretagMacbeth™ ColorChecker�. Gerard Kimgma's article on Gamutvision and PrintFIX Pro has been published in Luminous-Landscape.com. Oct. 14, 2006. Gamutvision 1.2 allows Black Point Compensation to be specified separately for the Left (1>2) and Right (3>4) data flows.
The image below illustrates the Gamutvision window. It has been reduced slightly.
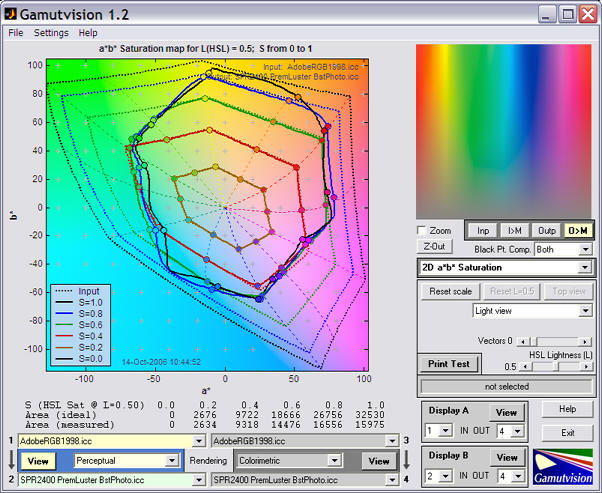
The selected input and output color spaces and rendering intent are highlighted on the lower left. Explanatory tooltips appear when the cursor is moved over buttons or controls.
The large image on the left contains the primary Gamutvision output: the 2D a*b* saturation plot of the input gamut (dashed lines) and mapped output gamut (solid lines) is shown. Additional displays, such as the 3D L*a*b* gamut plot shown near the top of this page, can be selected.
The small image on the upper-right contains the input or output test image, either in its original form or mapped ( or ) to the monitor color space (usually similar to sRGB).You can use this image to compare colors of the original and the transformed images.
The above plot shows the gamut for the Adobe RGB (1998) color space (the input profile) mapped with Perceptual rendering intent to SPR2400 PremLuster BstPhoto.icc (an ICC profile for Epson R2400, Premium Luster). The gamut achieved when mapping from Adobe RGB is distinctly better than sRGB but somewhat smaller than the full printer gamut. These results can be compared with a scanned print. Despite the R2400's evident weakness in the greens, blues, and magentas, it is state-of-the-art for pigment-based printers in 2006. A comparison with the Epson 2200 (the previous generation) shows little change in color gamut and a modest increase of 0.13 in Dmax (the maximum printable density).
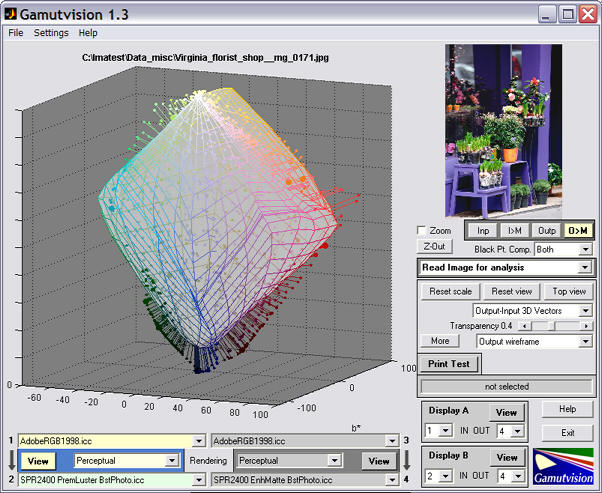
The plot below shows the 3D L*a*b* results of this gamut mapping for an actual image. The circles represent colors in the image file. The ends of the lines are the printed colors.The ends are somewhat obscured by the semitranparent wireframe display of the (mapped) output color space. This display can be made transparent. opaque, or it can be turned off. It can also be rotated and zoomed.
| Gamutvision instructions |
| Installing Gamutvision | Using Gamutvision — essential instructions: getting started | Gamutvision displays |
| Image color analysis with Gamutvision |
| Gamutvision examples and tutorials These pages, which illustrate a few of Gamutvision's many uses, make excellent tutorial material. They will help you to get the most out of Gamutvision. |
| Identifying defective profiles — illustrates a popular profile with a glaring defect and points to a solution. |
| Evaluating printer profiles with Round trip — illustrates Gamutvision's Round trip rendering intent. |
| Profile mystery: The case of the smudged pines — sheds light on a profile defect that smudges a print of pine trees. |
| Black Point Compensation — shows the meaning of the mysterious checkbox. |
| Camera and scanner profiles — shows what happens when you convert to standard color spaces. |
| Printer gamuts: total and real — shows the difference between a printer's theoretical (i.e., maximum) color gamut and the real color gamut achieved when working with standard color spaces. |
Gamutvision uses ICCTrans, the Matlab interface to the LittleCMS color management system. The ICCTrans source code is on Github. The ICCTrans manual may have disappeared from the Internet, so we've put it on the Gamutvision website. Many thanks to Ignacio Ruiz de Conejo and Marti Maria (of Hewlett-Packard Spain) for their outstanding work.